

Lack of empathy
People felt that each provider communicated as though its pension was their only one, ignoring the wider retirement picture.
One place to see every pension you've ever had
Led discovery and UX vision for the UK's national Pensions Dashboards Programme, from segmentation-based personas to the three-year roadmap, and managed the programme website as its communications hub.
Most people in the UK build up more than one pension over a working life. Automatic enrolment brought more people into workplace pensions, yet around 12 million were still estimated to be under-saving for later life. Department for Work and Pensions research identified gaps in people’s understanding of, and motivation to seek out, retirement information.
The information people needed was scattered. Each pension provider held its own record, in its own format, behind its own login. To understand what they’d saved, someone had to track down every provider they’d ever held a pension with, remember the details, and piece the picture together themselves. Many didn’t. The Pensions Policy Institute estimated that millions of pension pots were not matched to their owner, worth billions of pounds in total.
The problem wasn’t just lost pots. It was a lack of ownership. When people can’t see what they have, they can’t plan for what they’ll need.
As Senior UX Lead, I led the discovery and translated the programme’s research into a shared UX vision. I developed segmentation-based personas, defined the experience goals for the dashboard and Retirement Planning Hub, and shaped the three-year roadmap. I also led the programme website as the communications hub connecting consumers, pension providers, regulators and technology suppliers.
The Money and Pensions Service (MaPS), the government-backed body that runs MoneyHelper, was responsible for delivering pensions dashboards through the Pensions Dashboards Programme (PDP). The Pension Schemes Act 2021 required pension providers and schemes to connect to the ecosystem and enabled MaPS, through PDP, to create dashboard standards with the approval of the Secretary of State for Work and Pensions.
Existing PDP research showed that estimated retirement income was the information consumers most wanted to see. I used that evidence to help define the experience priorities: bring retirement income to the foreground, reconnect people with lost pots and give users a clearer sense of control over their pensions.
I developed the personas from MaPS’s existing segmentation model, which grouped the population as struggling, squeezed or cushioned. I combined those financial circumstances with life stage so the programme could distinguish between people whose pension needs looked very different, rather than designing for an average saver.
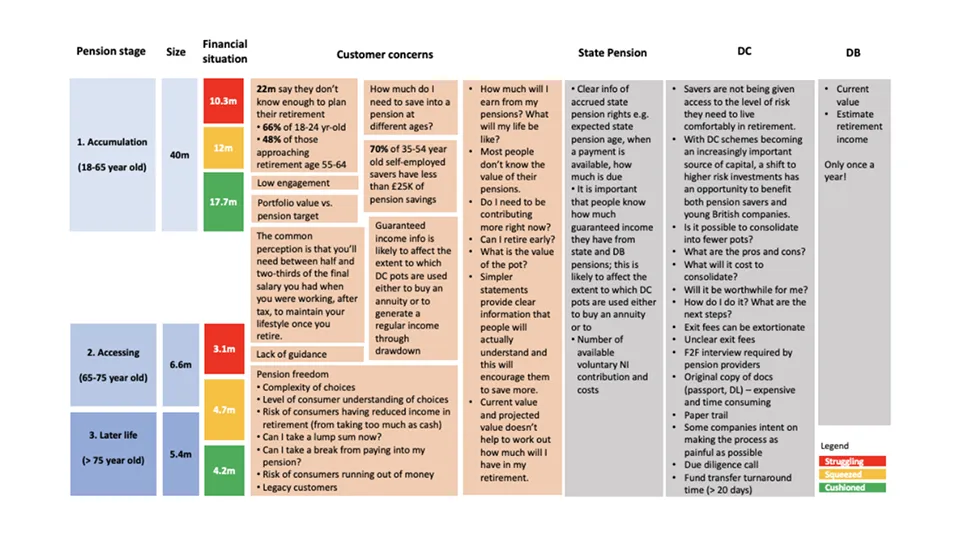
The segmentation covered around 40 million people still building up savings: roughly 10.3 million struggling, 12 million squeezed and 17.7 million cushioned. Their concerns differed by circumstance and life stage. For example, self-employed savers aged 35 to 54 were particularly exposed, with 70% holding less than £25,000 in pension savings.
And for anyone approaching access decisions, the questions were basic and urgent: can I retire early, what will I earn from my pensions, and what is my pot actually worth?
The personas gave the programme a shared way to test its vision. I used them to show that the dashboard could not simply display the same information to everyone. Its language, guidance and routes into retirement planning had to reflect someone’s circumstances and stage of life.
Existing programme research captured several recurring themes:
Lack of empathy
People felt that each provider communicated as though its pension was their only one, ignoring the wider retirement picture.
Broad variety
People could hold several different pension types, including Pension Protection Fund membership, defined benefit, trust-based defined contribution, group personal, master trust, public sector and State Pensions.
Monetary values
Different pension types calculated and presented value in different ways. Creating a comparable view meant resolving questions about valuation dates, defined benefit calculations, drawdown assumptions and how to show tax-free cash simply.
Multi-option confusion
Understanding one pension could be difficult. Managing several sets of options and paperwork multiplied the confusion and encouraged people to put off planning.
Criticality of completeness
People needed to see their complete pension provision and estimated retirement income against a target before they could judge whether they were on track. That complete picture could help them decide whether to contribute more, change investments or retire later.
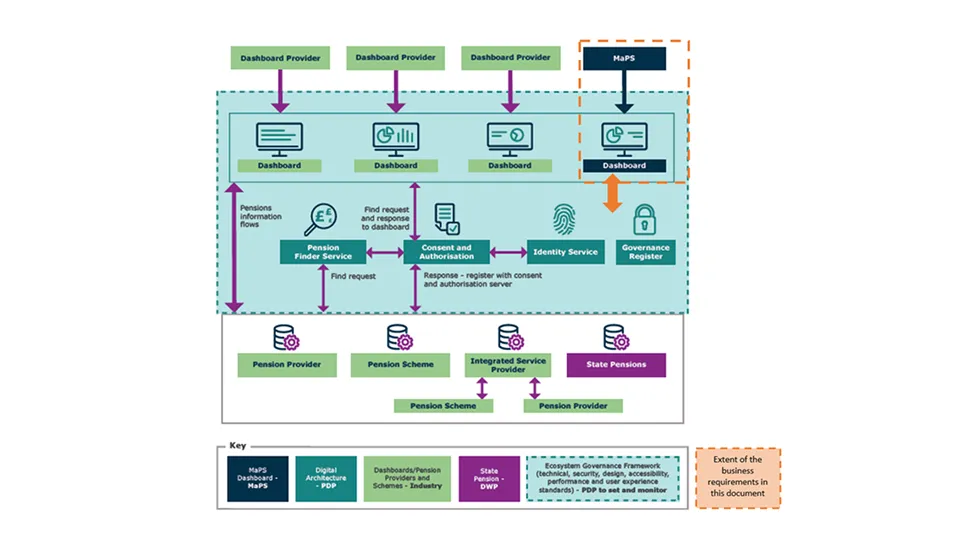
The scale of the technical challenge was equally clear. Pensions dashboards would show a user their pensions information online, securely and all in one place. It sounds simple, but multiple parties and technical services need to be connected, in what the programme refers to as an ecosystem, to make dashboards work. The ecosystem is made up of pensions dashboards themselves, find and view interfaces for pension providers and schemes, and the central digital architecture. PDP is responsible for designing and implementing that central digital architecture, and for developing the standards that provide the rules and controls for ongoing connection to the ecosystem.
This wasn’t a single product with a single user. It was a mandated national infrastructure initiative, and before anything could be designed there had to be a shared picture of what the experience should be and who it served.
The users were tens of millions of UK citizens, and the stakeholders were the government, the regulators and the whole pensions industry. Every goal had to work for both sides, because the ecosystem only functions when everyone in it is moving in the same direction.
I translated the programme’s intended outcomes into a shared set of experience goals for the dashboard and Retirement Planning Hub:
Reconnect
Reconnect individuals with lost pension pots, benefitting the individual and industry
Ownership
Build a greater sense of individual control and ownership of pensions
Awareness
Increase individual awareness and understanding of their pension information and estimated retirement income
Guidance
Provide access to pensions information when a consumer chooses, thus supporting guidance and advice processes
Engagement
Increase engagement, with more people taking advantage of the available impartial guidance and advice
Choice
Enable more informed decumulation choices through easier access to the information needed for decisions
The ecosystem those goals sat in had a defined shape, and the vision had to respect it. Dashboard providers sat on top, each running their own dashboard, with MaPS building its own as one of several. Beneath them ran the digital architecture that PDP owned: a Pension Finder Service to locate pots across the industry, a consent and authorisation layer so people controlled who saw what, an identity service, and a governance register. Below that sat the industry itself: pension providers, pension schemes, integrated service providers acting on their behalf, and the State Pension held by DWP. PDP set and monitored the standards across all of it, covering technical, security, design, accessibility, performance and user experience.
The research set the direction for what the experience had to deliver. The programme’s priorities were built around the human outcomes it existed to serve: reuniting savers with lost pensions, enhancing financial engagement, and empowering informed retirement planning decisions. Each one shaped what the dashboard experience had to do. PDP’s research showed that estimated retirement income was the information people most wanted to see, so that had to go front and centre: a clear, secure view of everything someone had saved, including the State Pension, made actionable rather than just visible. For someone who had lost track of a pension pot, it could mean the difference between a comfortable retirement and a difficult one.
Alongside the dashboard sat the vision for the Retirement Planning Hub, the piece that would turn information into decisions. Where the dashboard answered “what have I got?”, the hub would help answer “what should I do about it?”. I translated that relationship into the planned three-year roadmap described below.
Alongside the vision work, I managed the creation and strategic evolution of the Pensions Dashboard Programme website. It served as the vital communications hub for the project, aligning three very different audiences: consumers who would one day use dashboards, the pension providers and schemes who had to connect to the ecosystem, and the suppliers building the technology.
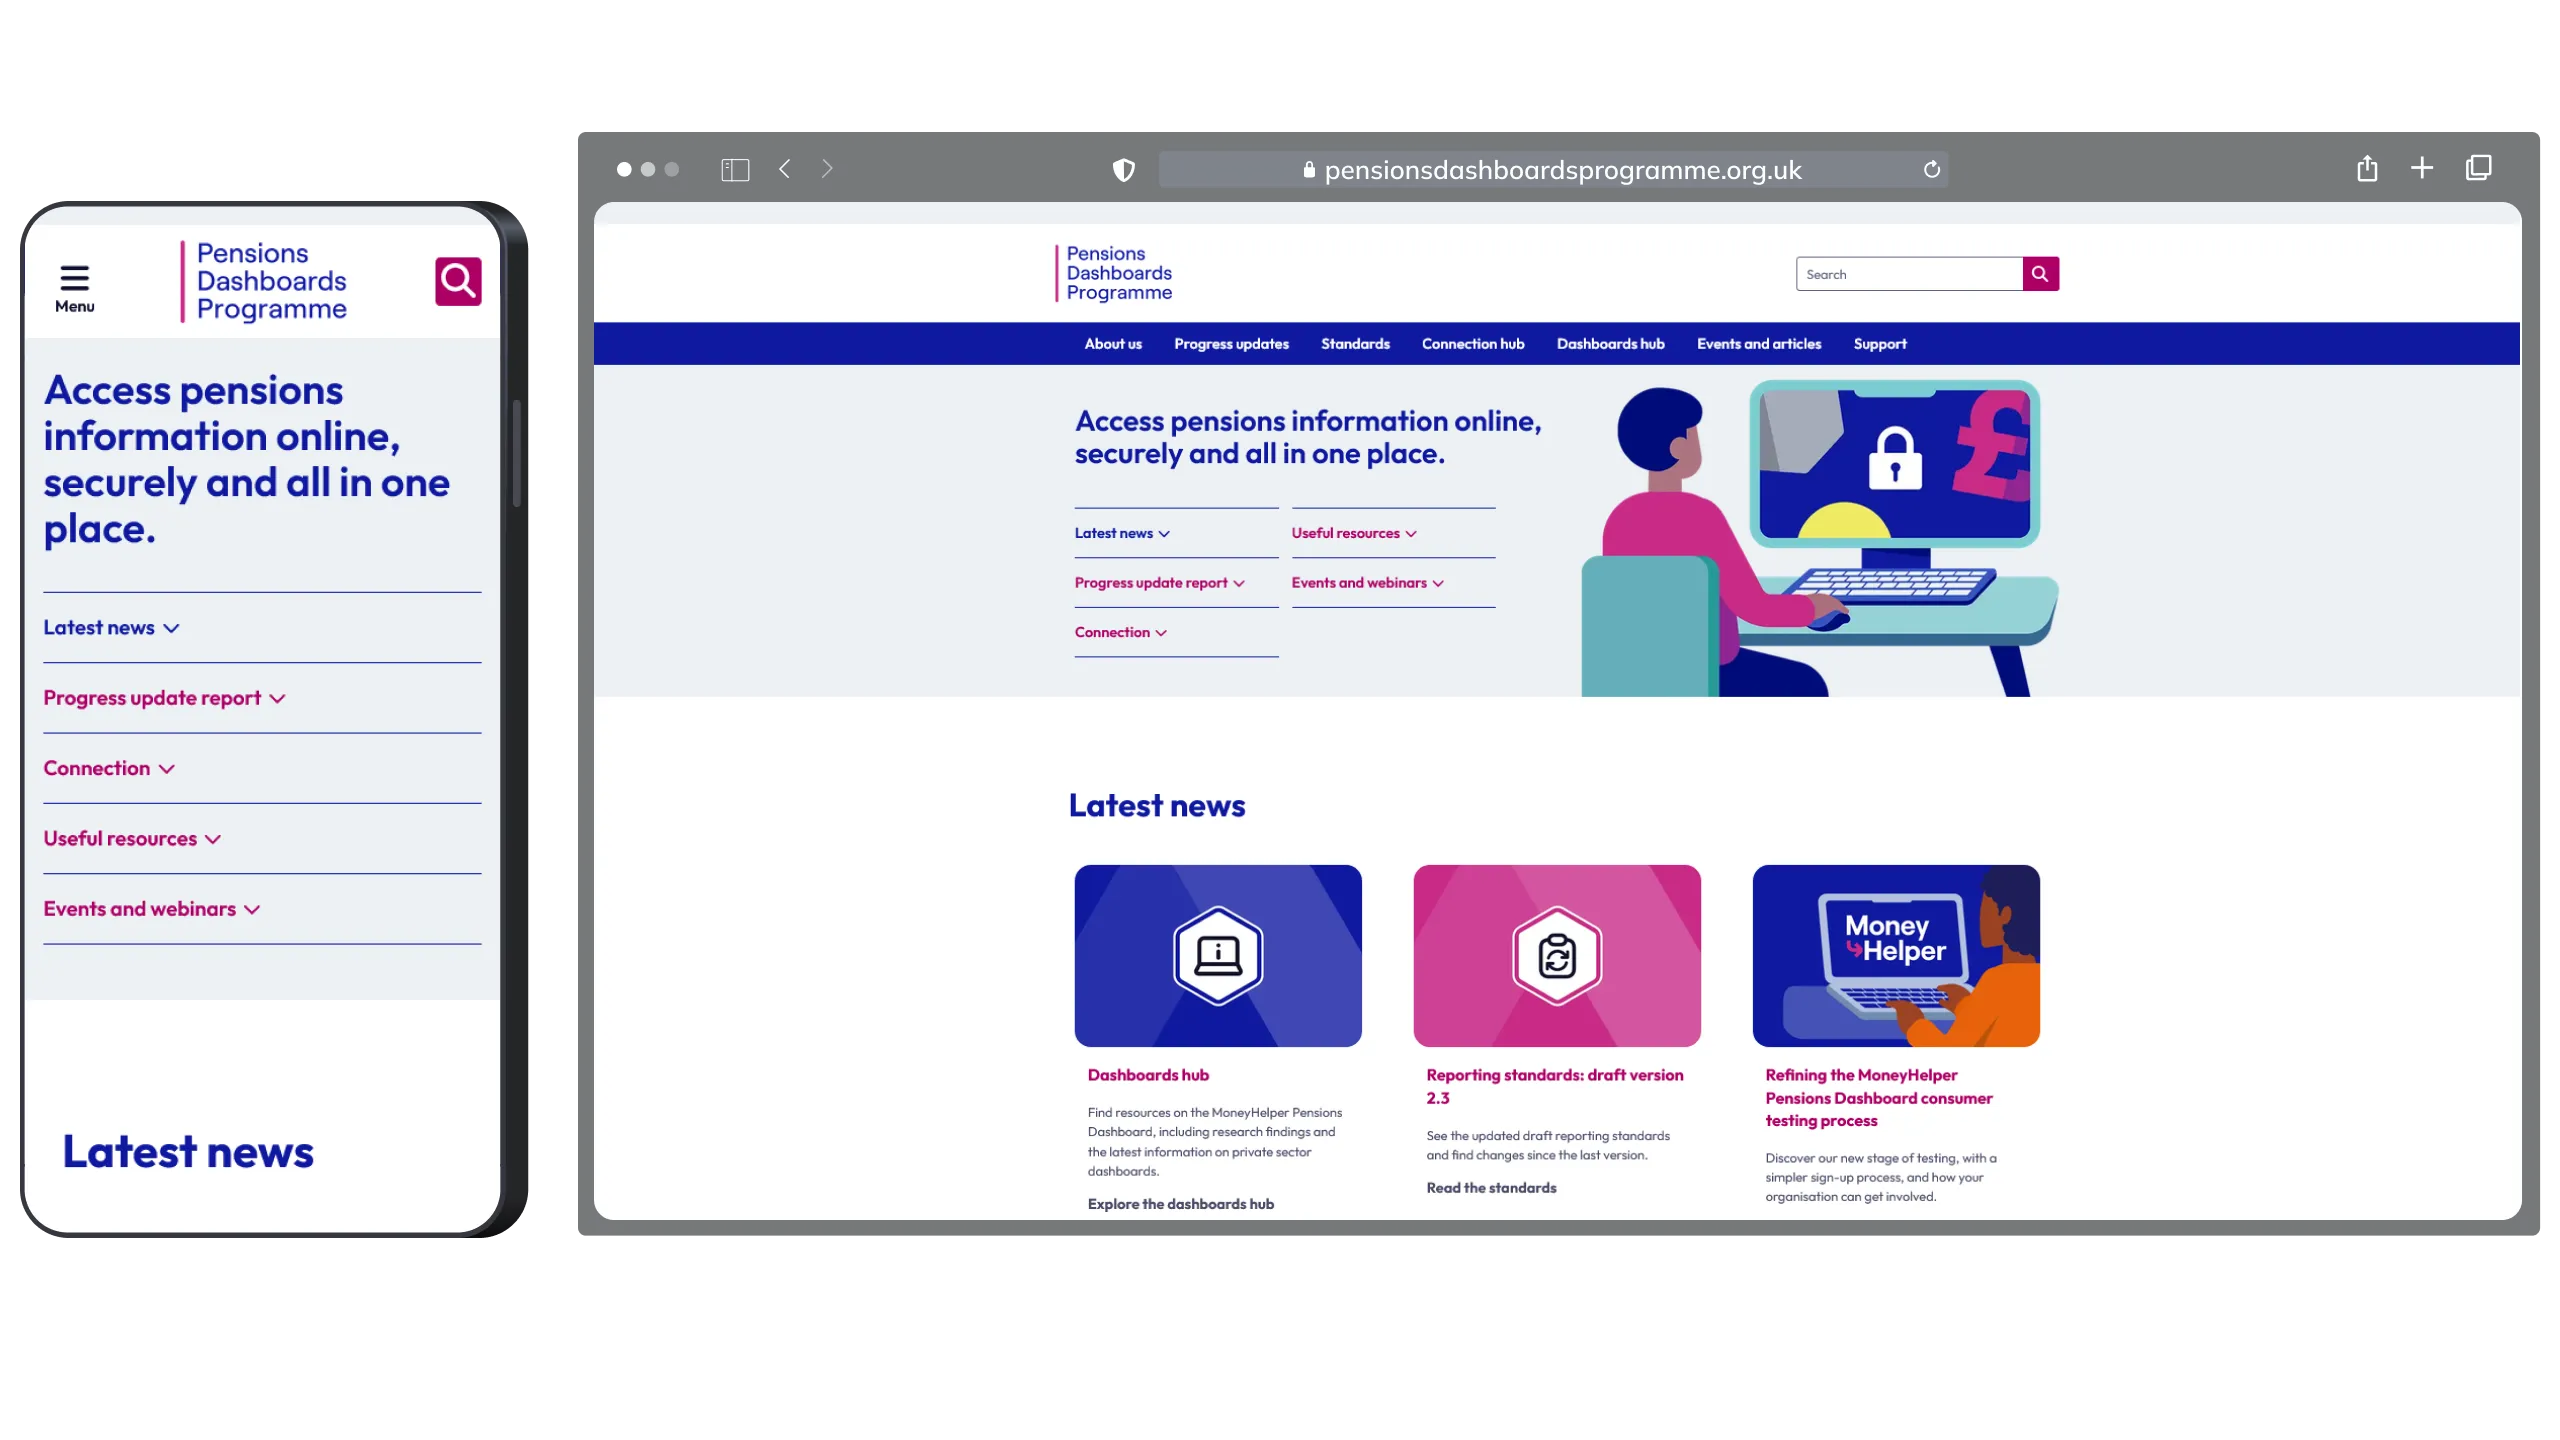
Stakeholder management ran through all of it. The programme brought together government, regulators, industry bodies and technology suppliers, each with their own priorities and language, and the site had to be the place where all of them could see the same picture. It had to work from day one and keep pace with a programme that would run for years. As the work moved through its phases, the structure and content of the site developed with it, so that everyone involved could see where the programme was and what it needed from them next.
By the end of my eight months with the programme, I had delivered the segmentation-based personas, the UX vision and goals for the dashboard and Retirement Planning Hub, and a three-year roadmap covering research, alpha, co-design, beta and delivery. I had also managed the creation and strategic evolution of the programme website as a shared communications hub for consumers, industry participants and technology suppliers.
I shaped a three-year plan that moved from research and alpha through co-design and beta to planned delivery and later development.
Year 1
Year 2
Year 3
The dashboard was still at an early stage when I moved on. My contribution was the strategic foundation: a clearer definition of who the service needed to support, what outcomes it should pursue and how the programme could move from discovery towards delivery. Subsequent programme development took place after my tenure.
Designing for a national infrastructure programme taught me that the user experience doesn’t stop at the screen. The dashboard itself was one part of a system that only worked if every participant moved together, and that meant the design had to serve the industry as much as the citizen. The communications hub was part of the product, not an afterthought. When you’re aligning consumers, providers and suppliers, the way you explain the programme is as important as the way you build it.
I’d also carry forward the discipline of designing around human outcomes without averaging people out. MaPS’s segmentation model made the differences concrete: a struggling private renter in their thirties and a cushioned empty nester approaching retirement may both hold pensions, but they need different language, guidance and routes into planning. For a national service, those circumstances have to shape the experience from the start.